skip to main
|
skip to sidebar
Climate Watcher
Points to ponder and questions to ask about climate change.
Tuesday, March 8, 2011
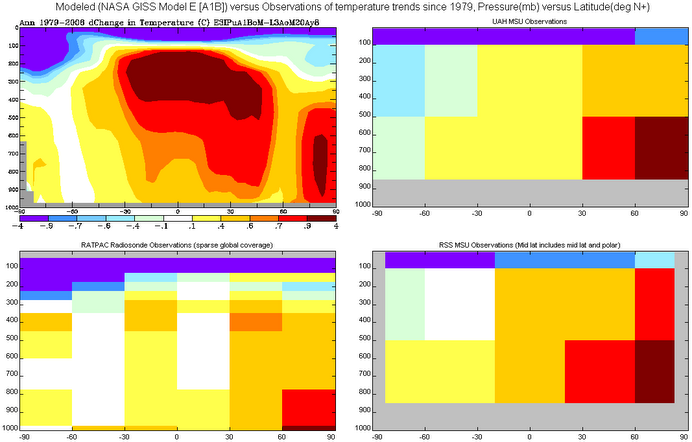
Variance in Global Warming Input/Output Terms
Newer Posts
Home
Subscribe to:
Comments (Atom)
Blog Archive
►
2012
(1)
►
February
(1)
▼
2011
(3)
►
May
(2)
▼
March
(1)
Variance in Global Warming Input/Output Terms